Automating the deployment of software to the various test, QA, and Production environments streamlines the software delivery process, provides a well-practiced routine prior to the production deployment, and removes a lot of the risks that come with depending on people's memories and checklists in order to get a working production push. Automating the deployment also makes the process more repeatable and less prone to error, simplifying the creation or recreation of an environment not just for the current release, but for past releases as well.

Delivery Pipeline - Focus of Current Post
This is the final post in a multi-part series on my Continuous Delivery pipeline project. The previous post followed the implementation of the automated interface stage, the second job in my chain of automated jobs. The last steps in my pipeline will be push button deployments to my QA and production environments. While I don't have a true QA process and the production environment is simply a subfolder on my personal site, I wanted to include these two steps because they will be common to most real pipelines.
The Dashboard
Early on in the project I found a "Build Pipeline" plugin for Jenkins and started looking into it. Before finding this, I was expecting I would have to write my own dashboard for visualization and triggering manual deployments. Luckily Centrum Systems has already done the hard work for us in creating and making available the "Build Pipeline" plugin.
As with other plugins, the "Build Pipeline" plugin is available through the "Available Plugins" menu in Jenkins. This plugin is what's known as a "View" plugin. It allows us to generate a new view of the build data on our dashboard, then layers additional functionality and available configuration values into the jobs.
The configuration instructions on the Build Pipeline Plugin page provide all the information that is necessary to get started.

Build Pipeline Plugin - Setup
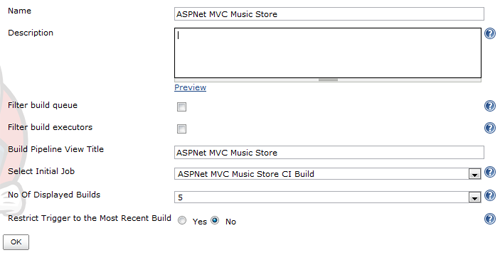
In the initial setup I have provided a name and title and, most importantly, selected the CI Build job as my pipeline starting point. Pressing Ok, the plugin looks at my build and will generate the pipeline starting at that selected project and tracing it forward through build triggers to any additional projects. In my case, I only have the CI build and the interface test job, so I get a pipeline with just two steps.
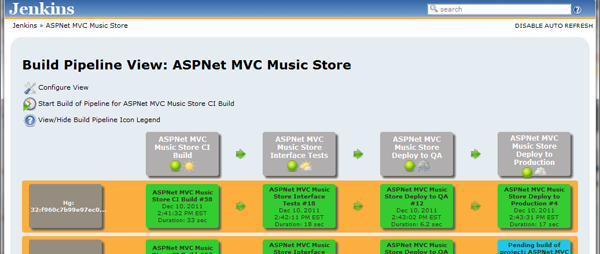
The pipeline dashboard shows me the two steps (left to right) of my current pipeline and the trigger on the left side (either the Hg revision number or "No revision" for manual builds). Inside each tile is the name of the job, date, and duration. Each tile also links to the details for the specific run.
Manually Execute Downstream Jobs
With the addition of the pipeline plugin, there is a new option available in the Post-build section to define downstream projects to be manually triggered.

Interface Job - Manual Trigger for QA Deployment
When the next step in a build chain is triggered by this type of build trigger instead of the normal trigger or parametrized trigger I added in the previous post, it is displayed in the pipeline dashboard with a button.

Pipeline Dashboard - Manual Trigger Button
These are perfect for our QA and production steps, as the build chain will execute up until this point and then wait for a human to make the decision to update the QA or production environment. When I push the button, the information is still available from the previous portion of the build chain, including environment variables (like the SOURCE_BUILD_NUMBER) that were set in the beginning.
Note: There is currently a bug in the Pipeline plugin where the value for a parametrized build is overwritten by it's default value when you retry a build. This means that currently if an Interface Tests job fails, retrying will retry for SOURCE_BUILD_NUMBER=0 instead of the proper value from it's previous step, which will fail. The value still works fine for the later steps, as there isn't a default to override it.
Now all I need is a QA and Production step.
QA and Production Deployment
The QA and Production deployment steps are going to be very nearly the same. Both will be responsible for getting the artifacts that were generated in the first step of the build chain, deploying those artifacts to the appropriate server, and then running the smoke tests to verify the deployment was executed successfully. These are all steps I have done in prior jobs, so this may actually be as easy as I expect it to be.
Creating the Deployment Jobs
To start with I create the empty "ASPNet MVC Music Store Deploy to QA" and "ASPNet MVC Music Store Deploy to Production" jobs in Jenkins. Returning to the Automated Interface job, I set the "Manually Execute Downstream Project" to my new QA job. In the QA job, I set the value to my Production job.
And I check twitter in both, because it's fun to see all the tweets.
Now, either because the environment variables are passed from the first job to all subsequent jobs or because there's some magic that happens when a build triggers a second one, I still have access to "SOURCE_BUILD_NUMBER" with the CI job's build number. This is good, because I can use almost exactly the same settings as the relevant steps in the Interface test job to build out these two new jobs:
- Windows Batch Step to delete local files: del /s /q *
- Copy Artifacts from another project, by number using SOURCE_BUILD_NUMBER
- Windows Batch Step to execute an msdeploy
- VBScript call to run the smoke tests
- Capture the test results in the post-build step
The only difference between the QA and production version of these is the MSDeploy script and the URL for the smoke tests.
QA MS Deploy Command:
"C:\Program Files\IIS\Microsoft Web Deploy V2\\msdeploy.exe" -source:package='%WORKSPACE%\PriorArtifacts\MvcMusicStore.zip' -dest:auto,computerName='AVL-BETA-01',userName='AVL-BETA-01\Administrator',password='MYPASSWORD',includeAcls='False' -verb:sync -disableLink:AppPoolExtension -disableLink:ContentExtension -disableLink:CertificateExtension -setParam:"IIS Web Application Name"="Default Web Site/MvcMusicStore_QA"
The production one, however, is deploying to a webhost and needs a different set of information in order to chat with my webhosts Management services.
Production MS Deploy Command:
"C:\Program Files\IIS\Microsoft Web Deploy V2\\msdeploy.exe" -source:package='%WORKSPACE%\PriorArtifacts\MvcMusicStore.zip' -dest:auto,computerName='https://DEPLOY_ADDRESS_PROVIDED_BY_HOST:8172/MsDeploy.axd?site=tiernok.com',userName='MY_USERNAME',password='MY_PASSWORD',includeAcls='False',authtype=basic -allowUntrusted -verb:sync -disableLink:AppPoolExtension -disableLink:ContentExtension -disableLink:CertificateExtension -setParam:"IIS Web Application Name"="tiernok.com/MvcMusicStore" -enableRule:DoNotDeleteRule
Because these jobs both rely on their upstream jobs to provide the necessary information, I can't test them manually until I have the whole pipeline together. However, the only new part of this is the msdeploy command, which I can run manually from the command line to verify it's working (or verify it's broken, tweak it, run again, run again, run again, curse, get it right, paste it back into Jenkins).
The Pipeline
With the addition of "manually execute deployments" to the QA and Production environment, I've completed all the pieces I outlined in my original pipeline plan.

Delivery Pipeline
The dashboard in Jenkins has incorporated these two new jobs and now shows all 4 in each row, along with the buttons for QA and Prod deployments that haven't run.
The individual tiles change color to indicate their status at a glance. As the build progresses, each step fires off a tweet to keep me up to date on what's going on.
And there we have it, my completed pipeline.
Next Steps
With the pipeline done, I now have any number of next steps I could pursue. It's bothered me that I took the easy way out on the database deployments, so I could return to add those in. I could also continue to extend the unit and interface tests, add static analysis of the code, even put in a step to verify that the HTML meets a published standard or that the page loads meet a minimum set of criteria.
It's been an interesting project, if a bit frustrating at times (thanks webdeploy). Feel free to follow up with me on the forums or in the comments below. If I do make additions to this later, I'll list them in the wiki post for the project.


