As part of a long series of posts, I implemented a version of the MVC Music Store tutorial application on top of a pair of SQL Server CE databases. SQL Server CE is great for small apps, being a portable file-based database that can easily be moved to a full SQL Server instance. Last week I migrated my application to use full SQL Server instances instead of the SDF file and picked up a 3x performance improvement. It was interesting enough that I decided to share ![]()
Note: I wasn't purposefully performance tuning my sample site. This move was a necessary step to prep for doing some other SQL Server related things with the project and the performance improvement was just a neat side effect.
The Results
The graph below shows the results of the load test stage of my build over several builds.
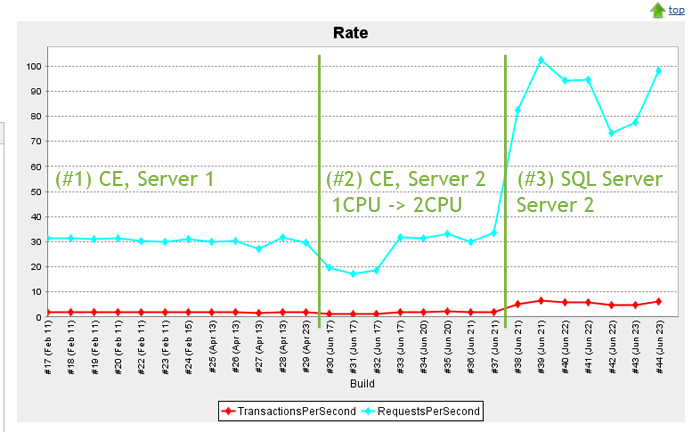
We start with the Rate graph. On the left we see a rate of about 30 requests/second from when the system was still on the SQL Server CE file and the build and beta VMs resided on their original home (i7 920, VMWare, using Hyper-V equivalent of 2 logical CPUs). In the middle we have the move to their new home (i7 3770K, Hyper-V 2012) still on the SQL Server CE file and switching from one to two virtual CPUs assigned to the beta web server. The last third is the results of moving the primary database to a SQL Server VM, which improved the performance by roughly 3x and appears to have found a new performance constraint.
The transaction rate has gone from about 1.8 to about 4.8 per second.
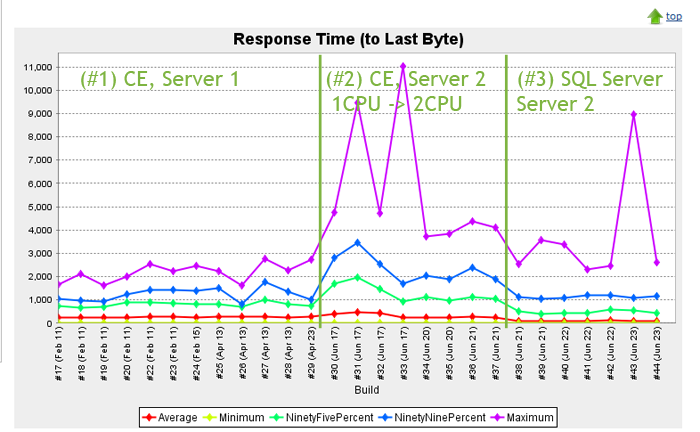
We can see the response times have been fairly stable, up to the 99% mark, with the max being a little wonky. The 95% and average marks have gone from averaging 650ms and 250ms on the original server with CE to 450ms and 80ms respectively on SQL Server.
The Details
The data for these results are generated automatically as part of the build process for my application. I have 3 dedicated VMs for the build server, a web server, and a database server and they are all currently housed on a 2012 Hyper-V server. Each is assigned about 2GB of RAM and 2, 1, 1 CPUs for the web, build, and DB server respectively. The host has nothing else running on it and is an i7 3770K w/ 16GB of high speed RAM behind it and mirrored standard drives on SATA III.
The data was collected as part of the automated Load Test step of the build process. During this step, the build server deploys a copy of the application to a website on the web VM and then spins up WCAT to load test the site. There is an incremental spin up period that warms up the site and connection pool, followed by a 2.5 minute sustained test where WCAT runs as fast as it can against the site.
The load test is a full transaction that makes the same requests a real world browser makes as it selects an album, adds it to a cart, and then checks out, including static content and dynamic content. Each transaction is in a unique session and reports the appropriate headers with each HTTP request. The increase from 1.8 to 4.8 transactions per second can be restated as an increase from 1.8 to 4.8 individual purchases per second.
The site is still on SQL CE for the membership database, which is used during the checkout, and it is using Entity Framework 4 for data access to SQL Server (so more headroom for improvement if I was actually tuning for performance).
After seeing the increase I thought it would be interesting to share the numbers as well as how useful it is to have a short load test as part of the delivery pipeline.