Applications and dependencies break, so monitoring should always be on our checklist for production applications. If you're hosting a site or application on Azure App Services, it's relatively easy to take advantage of the "Availability" option from Azure App Insights to provide health monitoring.
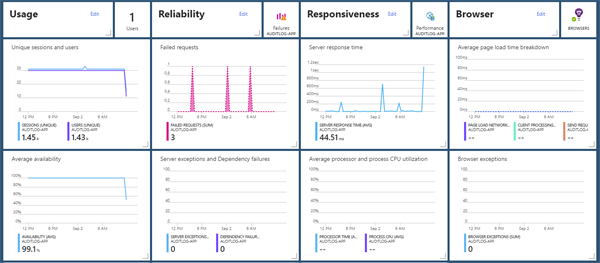
I like using Azure App Insights for monitoring on smaller sites because I typically have it turned on already for operational analytics:
Setting up a dedicated health endpoint allows us to:
- Check specific states of dependencies to reflect them in the application health
- Switch to a fuller-featured monitoring and notification system as we scale
Additionally, by having a dedicated health endpoint we can return information that will get us a step or two ahead in troubleshooting, when something does break.
Adding a Health Endpoint
The first step is to add the health endpoint to the application. This will return a general status via the HTTP status plus some richer detail in the body. When we receive an email notification, the body is going to help us get to the root of the problem faster.
In this case, I have a web application that depends on Azure SQL, so when everything is good,
I'll send a 200 OK HTTP response like this:
{
    "isGood": true,
    "webServer": { "status": 0, "details": "Ok" },
    "sqlServer": { "status": 0, "details": "Ok" }
}
And if the database were in a bad state, I would expect a 500 Internal Server Error HTTP
status with something like this:
{
    "isGood": false,
    "webServer": { "status": 0, "details": "Ok" },
    "sqlServer": { "status": 1, "details": "Database status check failed" }
}
I'm using ASP.Net Core 2 with attribute routing. I'll add a new /health/status endpoint like so:
[ApiVersion("1")]
[Route("health")]
public class HealthController : Controller
{
    // ... ctor + DI ...

    [HttpGet("status")]
    [Produces("application/json")]
    public async Task<IActionResult> GetStatusAsync()
    {
        var status = new StatusModel()
        {
            WebServer = GetWebServerStatus(),
            SQLServer = await GetSQLServerStatusAsync()
        };

        return StatusCode(status.IsGood ? 200 : 500, status);
    }

    private StatusModelDetail GetWebServerStatus()
    {
        // ... perform a check ...
    }

    private async Task<StatusModelDetail> GetSQLServerStatusAsync()
    {
        // ... perform an async check ...
    }
}
Adding Monitoring
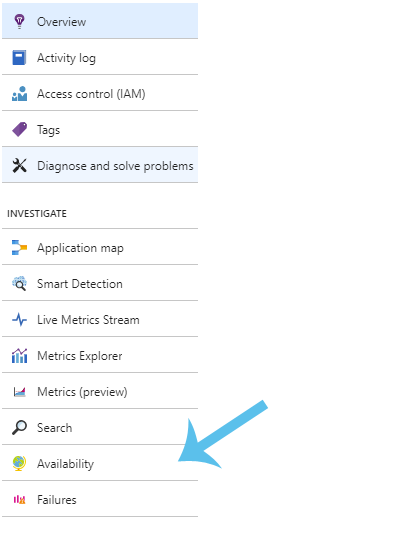
To add monitoring in Azure, first go to the Application Insights associated with your web site and select the "Available" option:
From there we can "+ Add Test":
- Test Type:
URL ping test - URL:
https://my-domain.com/health/status - Test Locations: (pick 5 locations)
- Success criteria:
HTTP response: 200, Test Timeout: up to you - Alerts: Configure a 5 minute window and configure alert emails/webhooks
For the success criteria, you could additionally set a phrase to match in the response to
ensure you're not getting a 200 OK with the wrong page's content. For instance, I expect
to see "isGood": true in all good responses.
As the Availability test starts running, you will start to build up Availability data like this:
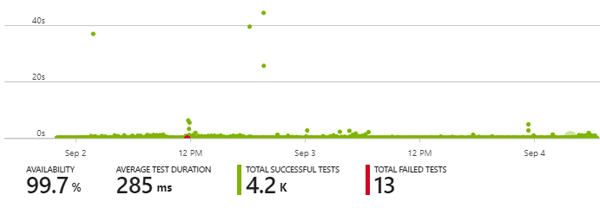
The red section is a where I've forced the database into an error for some testing, as well as several long responses as I tested other activities. This helped me verify the monitoring was working before I needed it for real.
During those failures, I received the email alerts almost immediately (thanks FastMail!). I could also have set up webhooks in Azure Insights to ping Slack or other services, had I wanted the information delivered differently.
And there we go, a pretty quick starting point for monitoring availability!